

- BTC nears $72K, up 4% as U.S.–Iran ceasefire hopes lift risk assets
- Markets rally broadly, with Wall Street futures up 3% on easing tensions
- Bullish case strengthens, supply squeeze + $76K breakout could target $100K
Bitcoin rose sharply on Wednesday, leading a rally across the cryptocurrency space after news of a two-week ceasefire between the US and Iran sparked stellar gains across risk-driven assets.
BTC price jumped 4% in the last 24 hours to trade at $71,593 as of 07:28 a.m. EST, even as total market capitalization jumped over 3% to $2.45 trillion.
US, Iran Signal Two-Week Ceasefire
The crypto market traced gains in stocks and gold after US President Donald Trump said he would hold off on attacking Iran for two weeks, with both sides reportedly working toward a ceasefire.
Iran also noted that the US had accepted the framework of a 10-point path towards a ceasefire and indicated that reopening the Strait of Hormuz was possible.
Pakistan proposed the ceasefire, stating that both Washington and Tehran had agreed to the deal, and offered to host direct talks in Islamabad later this week.
Risk assets rallied on hopes of a resolution, with Wall Street futures jumping by more than 3% in Asia during Asian trading hours.
Bullish Case Cemented As Strategy Absorbs Nearly 3X New BTC Supply
To add to the bullish case, Strategy is taking supply off the market faster than miners can replace it. Since March 2, Strategy’s Bitcoin holdings have risen by 46,233 BTC, while miners have produced only about 16,200 BTC over the same period, indicating it has absorbed nearly three times the new supply.
The continued demand comes through STRC, Strategy’s variable-rate preferred stock. When STRC held near par above its $100 par value, Strategy kept issuing shares and accumulating BTC.
For example, in the last week, Strategy raised $102.6 million in STRC sales to help fund a Bitcoin purchase valued at over $330 million.
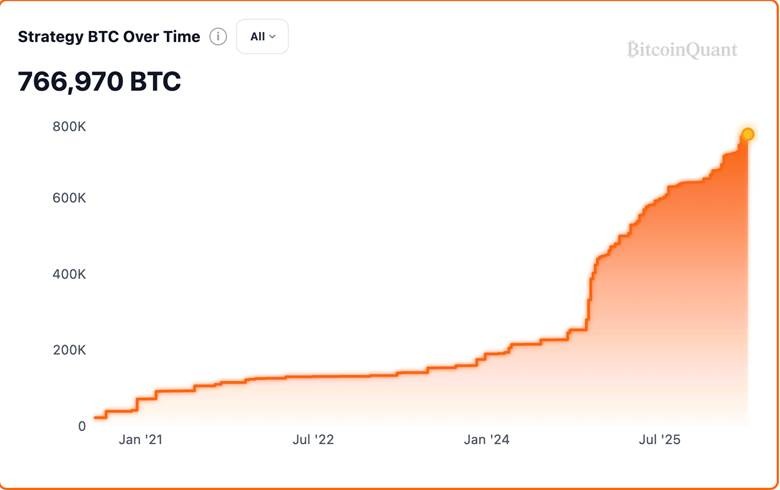
Strategy’s BTC holdings chart.
BTC Could Invalidate Bear Flag, Sets For Rally Towards $100K
Bitcoin is trading within a bear flag pattern that projects a breakdown toward the sub-$50,000 area, roughly 30% below current levels.
Normally, a bear flag remains a bearish continuation pattern because there is not enough demand to overcome the broader downtrend.
However, the bearish flag seems to be failing, with BTC now trading towards the $72,000 area. A breakout above the $76,000 area could invalidate the immediate bearish continuation setup and shift focus to the bullish measured-move target near $100,000.
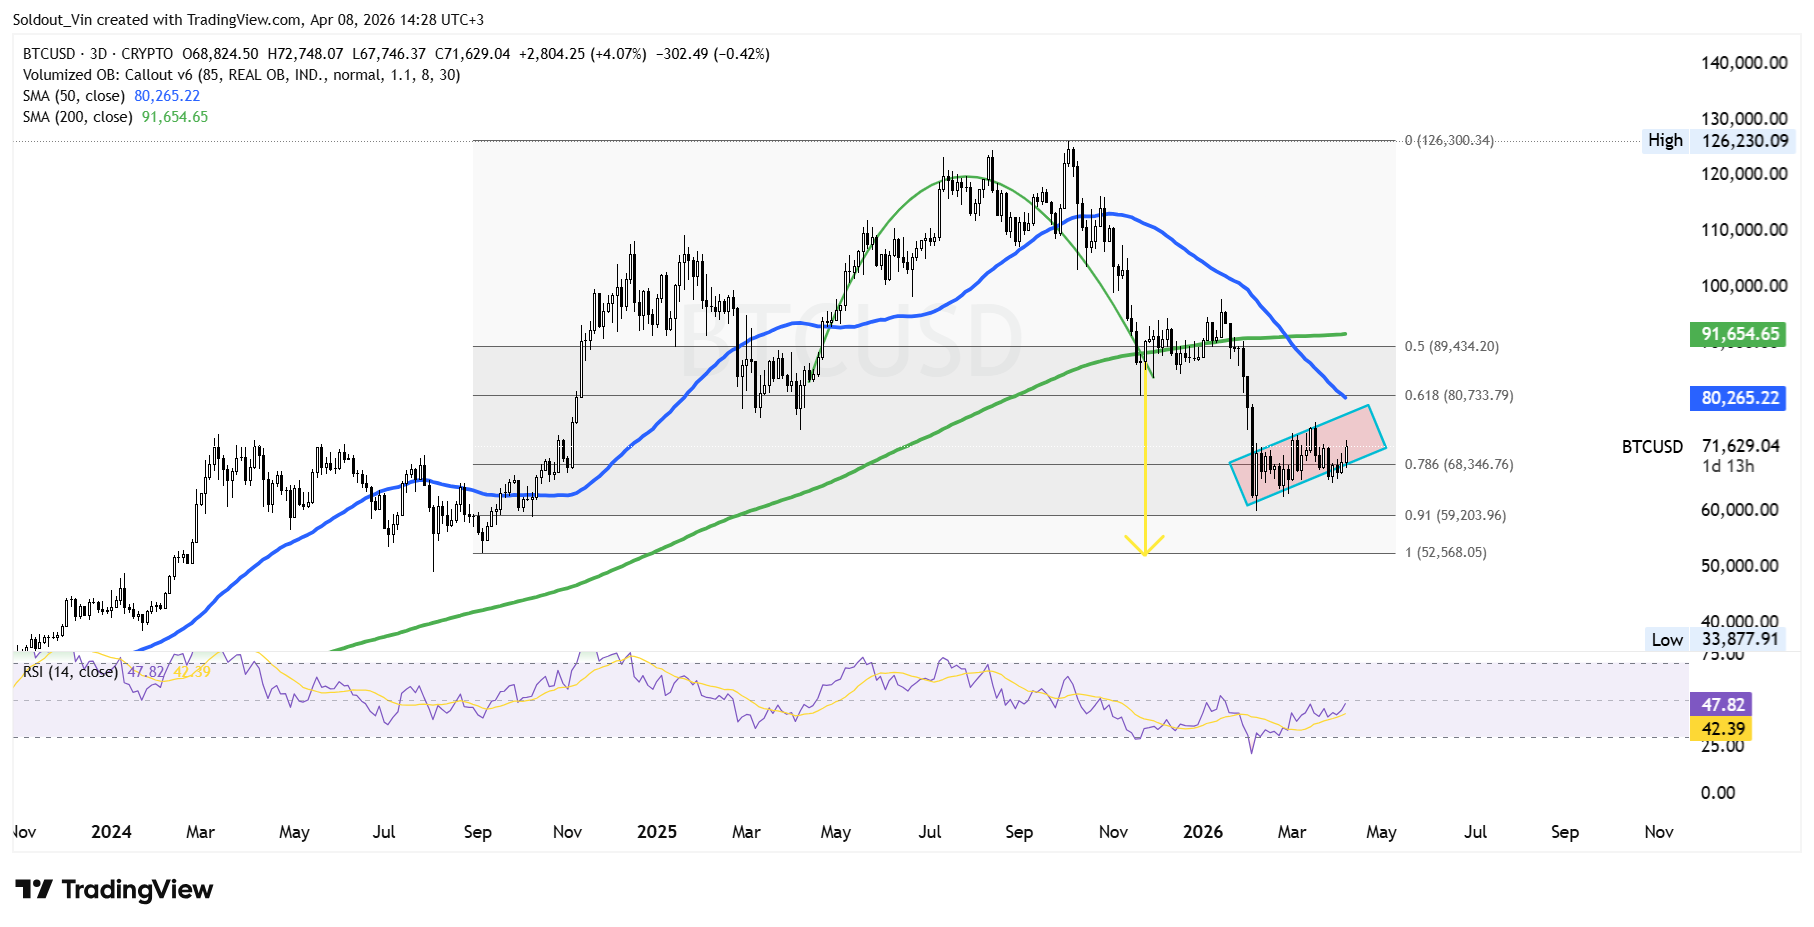
BTC/USD Chart Analysis: TradingView
Another factor supporting the upside case in Bitcoin’s position near its 50-day Simple Moving Average (SMA) on the 3-day timeframe (blue wave). This level acts as the next major resistance level and a previous support area in 2025, around the 0.618 Fibonacci level ($80,733).
Moreover, the Relative Strength Index (RSI) has since surged from the 30-oversold region, currently rising towards the 40-region at 39. The rising RSI signals that buyers are pouring in, suggesting demand may rise soon.